The Admin Dashboard serves as the primary oversight hub for your search engine, providing real-time data on system performance, user engagement, and the tangible environmental benefits of your “Surgical Indexing” model.
📊 Real-Time Cache & Asset Statistics
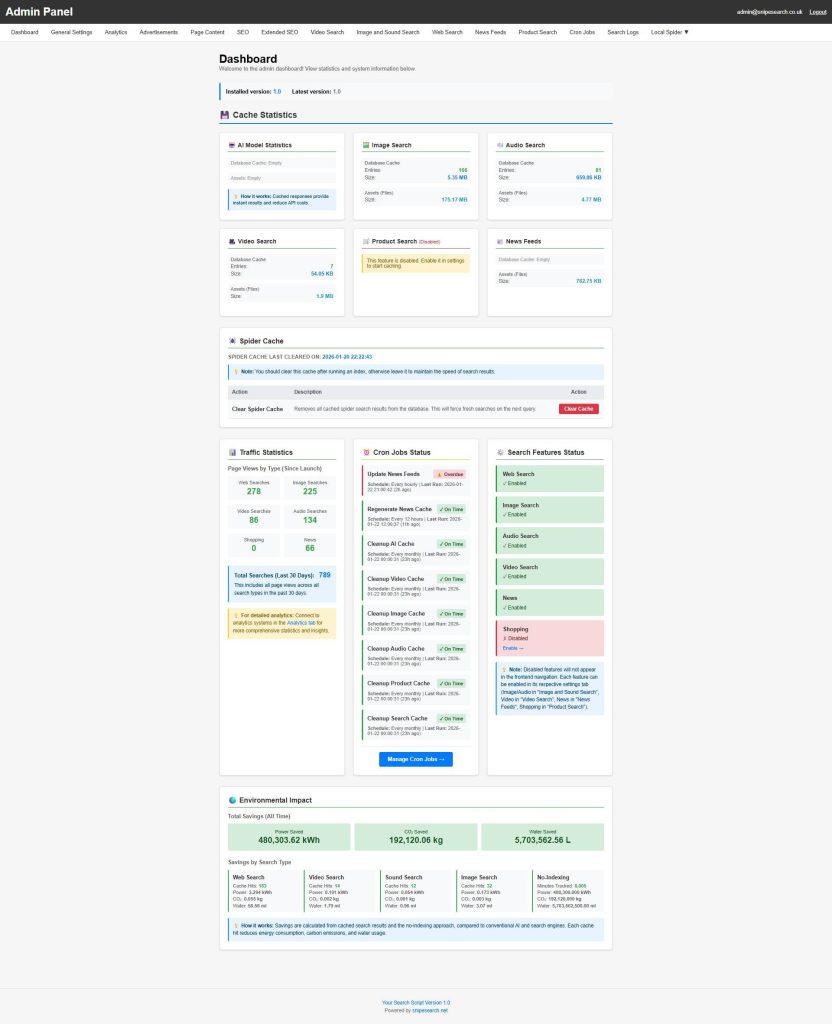
The dashboard provides a granular look at how much data your server is locally managing to ensure millisecond response times:
- Database Cache: You can track the exact number of entries and total file size for every search category, including Web, Audio, Image, and Video searches.
- Asset Management: Beyond database entries, the dashboard monitors the size of physical assets (like image and video thumbnails) stored on your server, ensuring you always know your storage footprint.
- Status Tiles & Populated Counts: At the top of the dashboard, a horizontal row of status tiles represents the six core search verticals: Web, Video, Image, Sound, News, and Product. Each tile displays a “Populated Count,” showing the exact number of records currently held in the temporary storage tables for that vertical.
- AI Summary Cache: An additional tile monitors the status of your intelligent answer layer, displaying the total number of synthesized responses stored in the
ai_summary_cachetable - Efficiency Tracking: These counts represent “remembered” results. High numbers indicate your engine is serving data from the local database in 50–100ms, successfully avoiding the costs and delays of external
📈 Traffic & System Health
Keep a pulse on your platform’s growth and technical reliability with dedicated monitoring sections:
- Search Analytics: View a breakdown of page views by type, Web, Image, Video, Audio, News, and Shopping, since launch, along with a total count for the last 30 days.
- Feature Status: A quick-view panel shows which search features are currently enabled or disabled. If a feature is inactive, it is automatically hidden from your site’s frontend navigation.
- Cron Job Monitoring: The dashboard tracks critical background processes, such as news feed updates and cache cleanups, flagging if a task is “On Time” or “Overdue”.
- UI Sync Logic: The dashboard acts as a real-time monitor; if a search vertical is disabled in your deeper settings, it reflects here instantly and the corresponding tab is automatically hidden from the public-facing homepage. This ensures users never encounter a broken or empty search category.
- The “Uninstalled” Spider State: For new installations, the dashboard will display a prominent “Install Spider” notification. This is a critical first-run action that redirects you to initialize the indexing engine for your specific database.
- Real-Time Storage Monitoring: The interface provides transparency for your system logs, displaying the current file size (e.g., “17.65 KB”) and the total number of entries recorded so you are never caught off-guard by log files consuming excessive storage.
🌍 Environmental Impact Tracking
One of the most unique features of the dashboard is the Environmental Impact panel. It quantifies the sustainability of your “Learn Once, Serve Forever” logic by comparing your cached results to the high energy demands of conventional search engines:
- Environmental & Performance Metrics (“Green Data”): The dashboard quantifies the sustainability of your “Learn Once, Serve Forever” logic through counters for Power (kWh), CO₂ (kg), and Water (L). These metrics represent the tangible resources not consumed because your engine served a result from its local sharded index instead of forcing a heavy, cross-continent API call to external providers like Amazon, eBay, or YouTube.
- Savings by Type: See the specific environmental contribution of each cache hit. For example, every time a user views a cached Web search, the dashboard calculates the exact milliliter of water and watt-hour of electricity saved.
- No-Indexing Advantage: The system even tracks the “Minutes Saved” by utilizing a no-indexing approach, further highlighting the efficiency of your surgical data model.
🛠 Administrative Control
The dashboard is designed for easy navigation, providing direct links to manage cron jobs or enable disabled search features through their respective settings tabs. It serves as a starting point for all administrative tasks, ensuring you have the data needed to optimize your search engine’s performance and profitability.
- Cron Job Infrastructure: This section provides the exact pre-formatted command-line strings tailored to your specific installation path, ready to copy and paste into your server’s Crontab.
- Health Indicators: Tasks are flagged as “On Time” or “Overdue,” monitoring critical automation like News Feed Updates (hourly), News Cache Regeneration (every 12 hours), and Monthly Cache Cleanup (1st of every month).
- Manual Overrides: The dashboard includes “Run Now” controls for every automated task, allowing you to manually trigger updates or cleanups if you cannot wait for the next scheduled run.